
UAE-Based Holding Group Transforms FP&A, Consolidation and Enterprise Reporting Intelligence.
How CONSOLYX enabled connected planning, multi-entity consolidation, driver-based forecasting and executive decision intelligence across 21 entities, 6 countries and 7 currencies.

|
Executive Summary A diversified UAE-based holding group replaced spreadsheet-heavy finance processes with CONSOLYX, a unified Financial Intelligence Platform for financial consolidation, FP&A software, budgeting and forecasting, driver-based planning, scenario planning, management reporting, KPI dashboards and AI-assisted finance insight. The transformation connected 21 entities across 6 countries and 7 currencies, reduced reporting cycle time by 75%, shortened the budget cycle by 60%, improved forecast accuracy by 35%, and gave leadership near real-time visibility across actuals, budgets, forecasts, scenarios, KPIs and executive reporting. |
1. Executive Summary
A large UAE-based holding group operating across the United Arab Emirates, Saudi Arabia, Qatar, Bahrain, Egypt and Lebanon had reached a point where traditional finance processes could no longer keep pace with the scale, complexity and speed of its business.
The group managed 21 entities across multiple industries, currencies, accounting structures and reporting timelines. Finance teams relied heavily on spreadsheets, manual reconciliations, email-driven budget submissions and delayed reporting packs. This created a familiar enterprise problem: capable finance professionals were spending more time preparing numbers than interpreting them.
CONSOLYX was implemented as the group’s connected financial intelligence layer above Oracle ERP, SAP, local accounting systems and Excel-based inputs. It unified financial consolidation software capabilities with FP&A software, budgeting and forecasting, driver-based planning, scenario modelling, rolling forecasts, variance analysis, KPI dashboards, management reporting, audit trail and AI for finance.
|
21 Entities Connected |
6 Countries |
7 Currencies |
|
75% Faster Close |
60% Faster Budget Cycle |
35% Better Forecast Accuracy |
Results at a Glance
|
Business Area |
Before CONSOLYX |
After CONSOLYX |
Measured Impact |
|
Month-end reporting |
15–18 working days |
3–5 working days |
Approximately 75% faster |
|
Annual budget cycle |
8–10 weeks |
3–4 weeks |
Approximately 60% faster |
|
Forecast accuracy |
68% |
92% |
35% improvement |
|
Manual spreadsheet effort |
High dependency on Excel and email |
Controlled workflows and automated calculations |
Approximately 70% reduction |
2. Client Background
The client is a diversified UAE-headquartered holding group with operations across energy, construction, real estate, manufacturing, trading, professional services, hospitality and technology services. Its regional footprint spans mature GCC markets and more volatile operating environments in Egypt and Lebanon, creating a demanding finance landscape for multi-entity consolidation, multi-currency consolidation and management reporting.
· Countries covered: United Arab Emirates, Saudi Arabia, Qatar, Bahrain, Egypt and Lebanon.
· Currencies covered: AED, SAR, QAR, BHD, EGP, LBP and USD.
· Operating structure: 21 entities across a complex regional and multi-currency environment.
· Technology landscape: Oracle ERP, SAP, local accounting systems, Excel uploads, trial balance uploads, HR headcount data, budget templates and forecast assumptions.
3. Business Challenge
Before CONSOLYX, finance was operating in a fragmented environment. Each reporting cycle required data collection from different ERPs, local accounting systems and spreadsheet models. The process worked, but it was slow, difficult to govern and increasingly unsuitable for a fast-moving regional holding group.
· Fragmented planning cycles across entities, business units and countries.
· Multiple local chart-of-account structures requiring controlled Local COA to Group COA mapping.
· Limited forecast accuracy caused by static spreadsheet assumptions and inconsistent driver logic.
· Annual budgeting requiring 8–10 weeks and multiple manual revisions.
· Month-end reporting packs taking 15–18 working days to finalize.
· Variance analysis performed manually without consistent driver-level explanations.
· No unified KPI framework linked directly to financial statements, actuals, budget and forecast data.
· Weak audit trail over uploads, adjustments, approvals, planning assumptions and report changes.
|
Executive Insight “The challenge was not a lack of finance capability. The challenge was that finance teams were trapped inside disconnected tools, manual reconciliations and reporting timelines that were too slow for executive decision-making.” |
4. Why Change Was Needed
The group’s leadership needed finance to become more forward-looking. Board meetings, investment decisions, cash flow planning and country-level performance reviews required faster, more reliable and more explainable numbers. The finance function needed a single operating model that could connect actuals, budgets, forecasts, scenario planning, KPI dashboards and management reporting without replacing existing ERP investments.
The decision was therefore not simply to buy another reporting tool. It was to create an enterprise performance management foundation that could support multi-entity consolidation, multi-currency reporting, driver-based planning, rolling forecasts, variance analysis, governance, audit trail and AI-assisted insights in one connected finance architecture.
5. CONSOLYX Solution
CONSOLYX was implemented as a financial intelligence platform above the existing ERP and accounting ecosystem. Rather than replacing Oracle ERP, SAP or local systems, CONSOLYX standardized the finance data model and created a controlled layer for consolidation, planning, forecasting, reporting, dashboards and AI-assisted finance analysis.
· Multi-entity consolidation and group reporting across 21 entities.
· Node-based organizational hierarchy supporting unlimited parent, subsidiary, branch, joint venture, associate and future acquisition structures.
· Local COA to Group COA mapping with validation controls.
· Multi-currency consolidation, currency translation and reporting currency alignment.
· Budgeting and forecasting with driver-based planning and scenario modelling.
· Rolling forecasts, scenario versions and controlled planning workflows.
· Actual vs Budget, Actual vs Forecast and Budget vs Forecast variance analysis.
· KPI framework connected to financial statements, reporting lines, departments, cost centers and business drivers.
· AI-assisted insights, anomaly alerts and management commentary for executive reporting.
Node-Based Group Architecture
A central design decision was to avoid a rigid parent-subsidiary-branch model. CONSOLYX implemented a node-based hierarchy where every holding company, subsidiary, division, plant, branch, joint venture, associate, department, cost center or future acquisition can be structured as a reporting node. This gave the group a scalable finance architecture without repeated database redesign.
|
Architecture Principle Group → Node → Node → Node → unlimited hierarchy. This structure allows finance teams to report, plan and consolidate at any level of the organization while preserving governance, ownership logic, mapping consistency and audit trail. Recommended visual: [Group Structure Illustration] |
6. Implementation Roadmap
The implementation followed a phased roadmap designed to move the group from fragmented finance processes to a connected enterprise performance management model. Each phase focused on business readiness, finance governance and user adoption—not only system configuration.
Phase 1: Finance Foundation and Master Data
The first phase established the group structure, node hierarchy, ownership model, currencies, Local COA, Group COA, reporting codes, departments, cost centers, scenarios and versions. This created the governed data backbone for all future consolidation, FP&A and reporting activities.
Phase 2: Actual Data, Mapping and Validation
Actual financial data was loaded from ERP systems, Excel files and trial balance uploads. CONSOLYX mapped local accounts into the group reporting framework and applied validation controls before data entered the reporting and consolidation engine.
Phase 3: FP&A Configuration
The group configured planning assumptions for revenue growth, sales price, inflation, salary increments, material rates, production volume, collection days, inventory days, payment days, interest rates, tax rates and FX rates. These assumptions were connected to driver formulas and account mappings to produce structured budgets and forecasts.
Phase 4: Reporting, Dashboards and AI
The final phase delivered financial statements, variance analysis, executive dashboards, KPI scorecards and AI-assisted commentary. Leadership could view performance by group, country, node, entity, department, cost center, reporting line and group account.
7. FP&A Transformation Journey
The FP&A transformation moved the group from static spreadsheet planning to a connected planning model where assumptions, drivers, budgets, forecasts, scenarios and actuals shared one governed data structure. This created a direct line of sight from business drivers to financial statements and executive KPIs.
· Revenue planning used Sales Volume × Sales Price and growth-rate assumptions.
· Cost planning used Production Volume × Material Rate and inflation assumptions.
· Payroll planning used Headcount × Average Salary and salary-increment assumptions.
· Working capital planning used Revenue × Collection Days / 365, COGS × Inventory Days / 365 and COGS × Payment Days / 365.
· Finance cost planning used Loan Balance × Interest Rate.
· Scenario planning enabled base case, best case, downside case and country-specific sensitivity analysis.
8. Financial Impact
|
Metric |
Budget USD |
Forecast USD |
Actual USD |
Variance vs Budget |
|
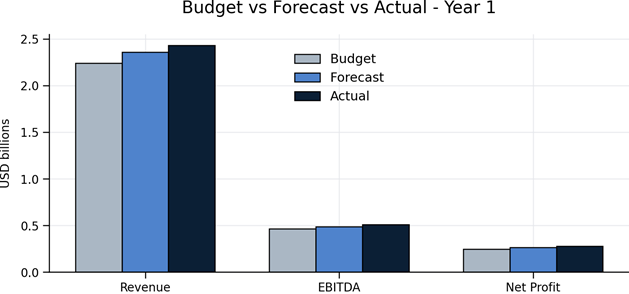
Revenue |
2.24B |
2.36B |
2.43B |
+8.5% |
|
Gross Profit |
742M |
798M |
822M |
+10.8% |
|
EBITDA |
464M |
488M |
512M |
+10.3% |
|
Net Profit |
247M |
263M |
278M |
+12.6% |
9. Operational Impact
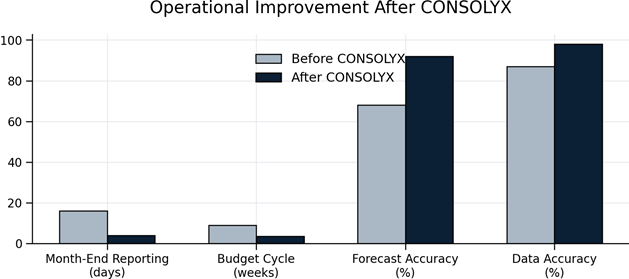
The operational benefit was immediate and measurable. Finance teams moved from repetitive data preparation to higher-value review, analysis and business partnering. The close, budget and forecast cycles became faster, more controlled and more transparent.
|
Operational Area |
Improvement Delivered |
|
Budget cycle |
Reduced from approximately 9 weeks to 3.5 weeks through workflow-based planning and version control. |
|
Month-end reporting |
Reduced from approximately 16 days to 4 days through standardized mapping, validation and reporting automation. |
|
Forecast quality |
Improved from 68% to 92% through driver-based planning, scenario logic and rolling forecast discipline. |
|
Data accuracy |
Improved from 87% to 98% through controlled mappings, validation checks and audit-ready workflows. |
10. Dashboard & Analytics Impact
CONSOLYX delivered executive KPI dashboards that allowed leadership to move from static reports to interactive decision views. Users could switch between group, country, node, entity, department and cost center perspectives while maintaining a consistent reporting structure.
· Revenue by country and entity.
· EBITDA by node and business segment.
· Budget vs actual and forecast vs actual analysis.
· Working capital trends including collection days, inventory days and payment days.
· Cash flow position and liquidity exposure.
· Top favorable and unfavorable variances.
· Scenario comparisons for revenue decline, inflation increase, FX movement and collection delay.
· KPI scorecards for Board and management reporting.
Recommended visuals: [Executive Dashboard Screenshot] [Budget vs Forecast Chart] [Variance Analysis Dashboard] [Regional Operations Map] [Executive KPI Scorecard]
11. AI & Forecasting Impact
AI-assisted management commentary
The AI insight engine helped finance teams convert numbers into management-ready commentary. Instead of drafting every explanation manually, users received structured variance narratives, risk alerts and recommended review areas, all subject to finance team validation before executive use.
Forecasting discipline
Forecasts became more transparent because assumptions were linked to business drivers, reporting lines and financial outcomes. Leadership could understand not only what changed, but why it changed and which driver caused the movement.
Scenario planning and sensitivity analysis
The group could model what happens if revenue declines by 10%, inflation increases by 5%, collection days increase by 15 days, or one country underperforms against forecast. This moved scenario planning from spreadsheet modelling to repeatable enterprise planning discipline.
Recommended visual
[AI Forecasting Dashboard]
12. Business Outcomes
· Finance moved from manual reporting to real-time performance visibility.
· Leadership gained one governed view of actuals, budget, forecast, scenarios and KPIs.
· Planning became driver-based, repeatable and explainable.
· Management reporting became faster, more consistent and more audit-ready.
· Variance analysis became structured by volume, price, FX, entity, country and node contribution.
· Cash flow control improved through working capital drivers and liquidity visibility.
· Finance teams gained more time for business partnering and strategic analysis.
13. CFO Perspective
|
CFO Perspective “CONSOLYX changed the role of finance from report preparation to performance leadership. We can now see consolidated results, budget movement, forecast risk, scenario impact and KPI performance in one environment. The biggest change is confidence: confidence in the numbers, confidence in the process and confidence in the decisions we take from the data.” |
14. Future Roadmap
|
Roadmap Area |
Planned Enhancement |
|
Rolling forecasts |
Expand quarterly and monthly rolling forecast cycles across all entities and major business lines. |
|
AI for finance |
Extend anomaly detection, forecast bias analysis and automated variance explanation under finance review. |
|
Scenario modelling |
Introduce country-level and business-unit stress testing for inflation, FX movement, margin pressure and working capital delays. |
|
Executive reporting |
Enhance Board packs with integrated KPI dashboards, management commentary and drill-down capability. |
15. Conclusion
|
Before CONSOLYX |
After CONSOLYX |
|
Manual Excel consolidation |
Unified node-based group structure |
|
Delayed reporting |
Automated actual, budget and forecast reporting |
|
Inconsistent COA mapping |
Controlled Local COA to Group COA mapping |
|
Weak scenario planning |
Scenario modelling and sensitivity analysis enabled |
Strategic outcome
The implementation transformed the group finance function from a reporting-driven department into a forward-looking strategic planning partner. CONSOLYX gave leadership the ability to evaluate performance, test scenarios, explain variances, monitor working capital and make faster decisions across a complex regional operating model.
Final results
· 21 entities connected across 6 countries.
· 7 currencies supported.
· 75% faster month-end reporting.
· 60% faster budgeting cycle.
· 35% improvement in forecast accuracy.
· 98% data validation accuracy.
· 95% variance explanation coverage.
· Near real-time executive dashboards.
Closing statement
· CONSOLYX delivered more than a budgeting tool; it created a unified financial intelligence platform for consolidation, FP&A, forecasting, reporting, dashboards and AI-assisted decision support.
· By combining node-based hierarchy, driver-based planning, automated reporting, variance analysis and governance controls, the group gained speed, control and executive visibility.
The finance function moved from manual reporting to real-time decision support with the scalability expected from an enterprise-grade financial consolidation software and enterprise performance management platform.