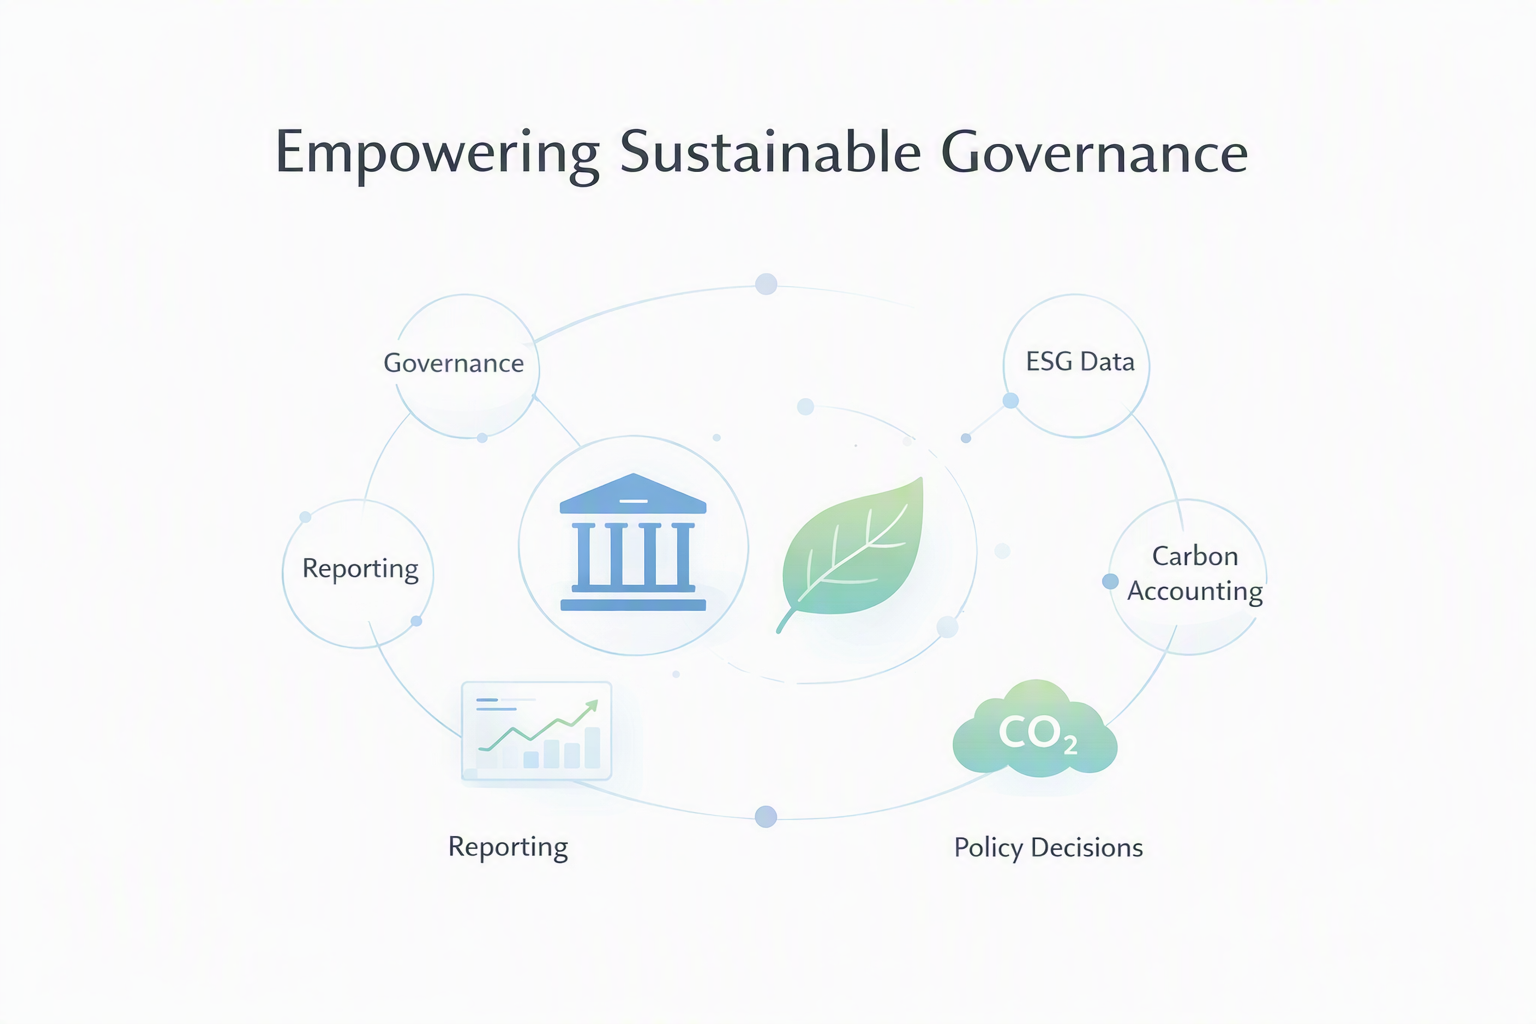
Building a National ESG and Carbon Monitoring Platform for Public Sector Facilities
A national public sector organization with 850+ facilities across 12 regions needed a cleaner way to manage ESG data, carbon accounting and sustainability reporting. Information existed, but it was fragmented across departments, spreadsheets, utility invoices and regional submissions.
CONSOLYX ESG was implemented as a centralized platform to validate facility data, calculate Scope 1, Scope 2 and selected Scope 3 emissions, map disclosures to sustainability frameworks, and provide decision-ready dashboards for leadership, regional teams and operational users.
Key Outcomes
|
Key Outcomes Delivered by CONSOLYX ESG |
|
|
✓ 850+ Facilities Centralized ✓ 1.8 million tCO2e Monitored ✓ Unified ESG Reporting Framework ✓ Executive Dashboards Implemented ✓ AI-Powered Sustainability Insights |
✓ Improved Audit Readiness ✓ Faster Reporting Cycles ✓ Stronger Regional Accountability ✓ Better Policy Execution ✓ Enterprise ESG Governance |
Executive takeaway: The project moved ESG from manual reporting to governed sustainability intelligence — improving visibility, accountability, audit readiness and policy execution across a large public sector portfolio.
Why This Project Was Different
This was not a simple reporting automation project. It created a repeatable ESG operating model that connected national policy priorities with regional execution, facility-level data ownership, carbon calculations, framework mapping, dashboards and evidence-based decision-making.
Client Profile
|
Profile Area |
Detail |
|
Type |
Government Entity |
|
Country Coverage |
1 country |
|
Regional Coverage |
12 regions |
|
Facilities |
850+ |
|
Employees |
25,000+ |
|
Annual Utility Spend |
USD 180 million |
|
Annual Carbon Footprint |
1.8 million tCO2e |
|
ESG Reporting Status |
Fragmented across departments and regions |
|
Dashboard Visibility |
Limited and not decision-ready |
Business Challenge
ESG information was spread across facilities, finance, procurement, human resources, safety, internal audit and regional administration. Each team used different templates, definitions and evidence practices.
Leadership lacked a reliable facility-level view of energy use, emissions, targets, compliance gaps and data quality. Reporting teams spent too much time reconciling spreadsheets instead of supporting policy action.
The organization needed a governed platform that could standardize data, improve accountability, calculate emissions consistently and provide a practical dashboard for decision-makers.
Why This Matters
|
PUBLIC SECTOR PERSPECTIVE |
|
Governments manage complex portfolios of facilities, infrastructure, energy systems and public services. Without centralized ESG intelligence, decision-makers struggle to identify high-risk facilities, monitor sustainability targets, evaluate climate risk and prioritize investments. Modern ESG platforms convert sustainability information into actionable public-sector intelligence. They help leaders move beyond compliance reporting toward evidence-based policy execution, budget prioritization and measurable sustainability outcomes. |
Key Problems
|
Issue |
Impact |
Risk |
|
Data fragmentation |
Departments and regions used separate templates and definitions. |
Inconsistent reporting and limited comparability. |
|
Carbon calculation inconsistencies |
Different assumptions and emission factors were used across facilities. |
Unreliable Scope 1, Scope 2 and Scope 3 reporting. |
|
Framework compliance gaps |
Required disclosures were not mapped to a central framework library. |
Incomplete submissions to regulators, funders or oversight bodies. |
|
No dashboard visibility |
Leadership lacked consolidated views by facility, region and emission source. |
Slow policy execution and weak intervention targeting. |
|
Manual reporting burden |
Teams spent time collecting, cleaning and reconciling spreadsheets. |
High effort, delays and increased error probability. |
|
Poor audit readiness |
Evidence, approvals and calculation logic were not consistently traceable. |
Weak assurance readiness and limited defensibility. |
|
Lack of accountability |
Data ownership and follow-up actions were not visible. |
Delayed corrective action and target slippage. |
Transformation Journey
|
Before CONSOLYX |
After CONSOLYX |
|
• Spreadsheets • Regional Files • Manual ESG Reporting • Carbon Calculation Inconsistencies • No Central Dashboard • Limited Visibility • Weak Audit Trails |
• Centralized Platform • Carbon Intelligence • Executive Dashboards • AI Insights • Framework Mapping • Target Tracking • Audit Ready Reporting |
Project Objectives
|
Objective |
Success Criteria |
|
Carbon accounting |
Calculate Scope 1, Scope 2 and selected Scope 3 emissions using governed emission factors and consistent facility boundaries. |
|
ESG monitoring |
Track environmental, social and governance indicators across all regions and facilities. |
|
Facility reporting |
Enable facility-level submissions with validation, ownership and evidence tracking. |
|
Government dashboards |
Provide national, regional and facility-level views for senior officials and operational teams. |
|
Framework compliance |
Map disclosures to relevant sustainability reporting frameworks and policy requirements. |
|
AI-supported insights |
Identify anomalies, missing data, high-energy facilities, reduction opportunities and target deviations. |
|
Audit readiness |
Create traceable data lineage from source submission to calculation, dashboard and disclosure output. |
Government ESG Operating Model
|
Component |
Value |
|
Ministry and Central Leadership |
Defines policy direction, sustainability priorities, reporting expectations and governance accountability. |
|
Regional Offices |
Coordinate facility submissions, review exceptions and drive local performance improvement. |
|
Facilities |
Provide source data for utilities, fuel, waste, water, safety, workforce and governance indicators. |
|
CONSOLYX ESG |
Centralizes data, validates submissions, applies carbon accounting logic and produces decision-ready dashboards. |
|
Policy Decisions |
Translate sustainability intelligence into investment priorities, corrective actions and transparent public reporting. |
CONSOLYX Solution
|
Layer |
Practical Role |
|
Source Data |
Captures facility, building, utility, fuel, travel, water, waste, workforce, safety, governance and target data from departments and regions. |
|
Validation |
Checks completeness, duplicate entries, abnormal values, missing evidence, period mismatches and facility ownership. |
|
Carbon Engine |
Applies approved emission factors and calculation rules to produce Scope 1, Scope 2 and selected Scope 3 emissions. |
|
Framework Mapping |
Links ESG indicators to disclosure requirements, policy commitments and reporting frameworks. |
|
Reporting |
Produces management reports, disclosure schedules, facility summaries and regional performance packs. |
|
Dashboard |
Provides executive, carbon, regional, target, compliance and operational visibility. |
|
AI Insights |
Highlights anomalies, reduction opportunities, missing data, disclosure gaps and budget optimization areas. |
Data Coverage
|
Core Data Areas |
Coverage |
|
Facilities and assets |
Facility register, buildings, ownership, region, type and operational status. |
|
Environmental data |
Energy, fuel, water, waste, travel and carbon activity data. |
|
Social and safety indicators |
Workforce, safety incidents, regional allocation and operational indicators. |
|
Governance and compliance |
Policies, approvals, controls, evidence, committees and accountability owners. |
|
Targets and performance |
Baselines, annual targets, reduction pathways, actual performance and variance status. |
Carbon Accounting Model
CONSOLYX structured the carbon accounting model around the widely used Scope 1, Scope 2 and Scope 3 classification approach. Scope 1 covered direct emissions from owned or controlled sources such as on-site fuel and fleet fuel. Scope 2 covered indirect emissions from purchased electricity. Scope 3 covered selected indirect activities such as business travel, waste and other relevant value-chain categories where data and material were available.
|
Scope |
Annual Emissions |
Interpretation |
|
Scope 1 |
420,000 tCO2e |
Direct fuel and operational emissions controlled by the entity. |
|
Scope 2 |
970,000 tCO2e |
Purchased electricity and energy-related emissions. |
|
Scope 3 |
410,000 tCO2e |
Selected indirect emissions from travel, waste and related activities. |
|
Total |
1,800,000 tCO2e |
National public sector facilities baseline. |
Sustainability Intelligence Dashboard
|
Total Facilities |
Annual Emissions |
Regions Monitored |
Dashboard Users |
|
AI Alerts Generated |
Compliance Indicators |
ESG Metrics Tracked |
Sustainability Targets |
SUCCESS FACTOR: The dashboard design combines performance metrics, data quality, compliance status, target tracking and climate risk indicators in one executive-ready view.
Six Recommended Website Graphics
|
Graphic |
Website Purpose |
|
Public Sector ESG Command Center |
Hero visual showing national ESG KPIs, carbon status, facilities and regional performance. |
|
Government ESG Operating Model |
Explains how policy, regions, facilities, platform workflows and dashboards connect. |
|
National Carbon Emissions Map |
Shows regional emissions distribution and supports targeted interventions. |
|
Regional Performance Heatmap |
Compares regional performance, highlights outliers and strengthens accountability. |
|
Target vs Actual Dashboard |
Tracks commitments, actual results, variances and corrective actions. |
|
CONSOLYX ESG Architecture |
Shows source data, validation, carbon engine, framework mapping, reporting, dashboards and AI insights. |
Results Achieved
|
Outcome Area |
Before |
After CONSOLYX |
Measured Improvement |
|
Reporting cycle |
8–10 weeks |
2–3 weeks |
70%+ faster ESG reporting and review cycle. |
|
Facility coverage |
Fragmented regional submissions |
850+ facilities centralized |
Single national facility-level ESG data view. |
|
Carbon visibility |
No consistent national footprint |
1.8 million tCO2e monitored by scope, source and region |
Clear emissions baseline and accountable ownership. |
|
Audit readiness |
Evidence dispersed across departments |
Traceable source-to-report workflow |
Stronger assurance readiness and defensible reporting. |
|
Decision visibility |
Static reports and delayed consolidation |
Executive, regional and facility dashboards |
Faster intervention planning and policy execution. |
|
Compliance readiness |
Framework gaps identified late |
Mapped disclosures, evidence and data status |
Reduced reporting risk and improved disclosure completeness. |
Applicable Public Sector Organizations
|
Applicable Public Sector Sectors |
|
|
✓ Ministries ✓ Municipalities ✓ Smart Cities ✓ Transport Authorities ✓ Healthcare Networks |
✓ Universities ✓ Water Utilities ✓ Infrastructure Authorities ✓ Public Housing ✓ Environmental Regulators |
PUBLIC SECTOR PERSPECTIVE: The model is applicable wherever government portfolios need centralized carbon accounting, sustainability intelligence, climate risk monitoring, ESG reporting, asset-level performance visibility and audit-ready evidence across distributed locations.
Executive Quote
“CONSOLYX gave us one governed view of sustainability performance across regions, facilities, emissions, targets and evidence. What previously took weeks of manual consolidation can now be reviewed through dashboards, exceptions and accountable workflows. For public sector leadership, that means faster decisions, stronger governance and clearer progress against sustainability commitments.
Senior Public Sector Transformation Sponsor
Why CONSOLYX ESG
|
Capability |
Public Sector Value |
|
Carbon accounting |
Consistent Scope 1, Scope 2 and selected Scope 3 calculations using governed factors and auditable logic. |
|
ESG data governance |
Clear ownership, validation controls, evidence tracking and approval accountability. |
|
Dashboard intelligence |
Executive, regional and facility-level visibility for faster intervention and policy monitoring. |
|
Framework mapping |
Links indicators to sustainability disclosures, commitments and compliance requirements. |
|
AI-supported insights |
Highlights anomalies, missing data, target deviations and practical reduction opportunities. |
|
Scalable architecture |
Designed for multi-region, multi-facility and multi-department public sector operating models. |
Call to Action
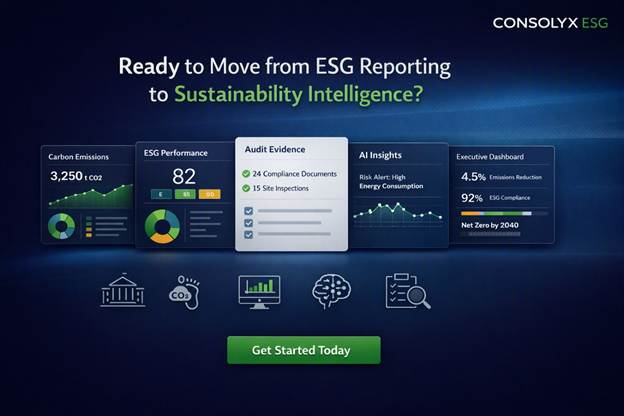
Ready to move from ESG reporting to sustainability intelligence? CONSOLYX ESG helps governments, municipalities and public sector organizations centralize carbon accounting, facility-level ESG data, sustainability dashboards, audit evidence and AI-powered insights in one governed platform.
|
Book a Demo |
Request the Case Study Deck |
Talk to an ESG Advisor |
Start with a focused ESG readiness conversation, review your current reporting model, and identify where CONSOLYX can create the fastest improvement in visibility, assurance readiness and executive decision-making.