Transforming ESG and Carbon Reporting Across a Multi-Entity Enterprise Group
How a diversified holding company used CONSOLYX as an Enterprise Sustainability Intelligence Platform to centralize carbon accounting, ESG performance management, executive dashboards and investor-ready sustainability reporting across countries, subsidiaries and facilities.
Enterprise Transformation at a Glance
|
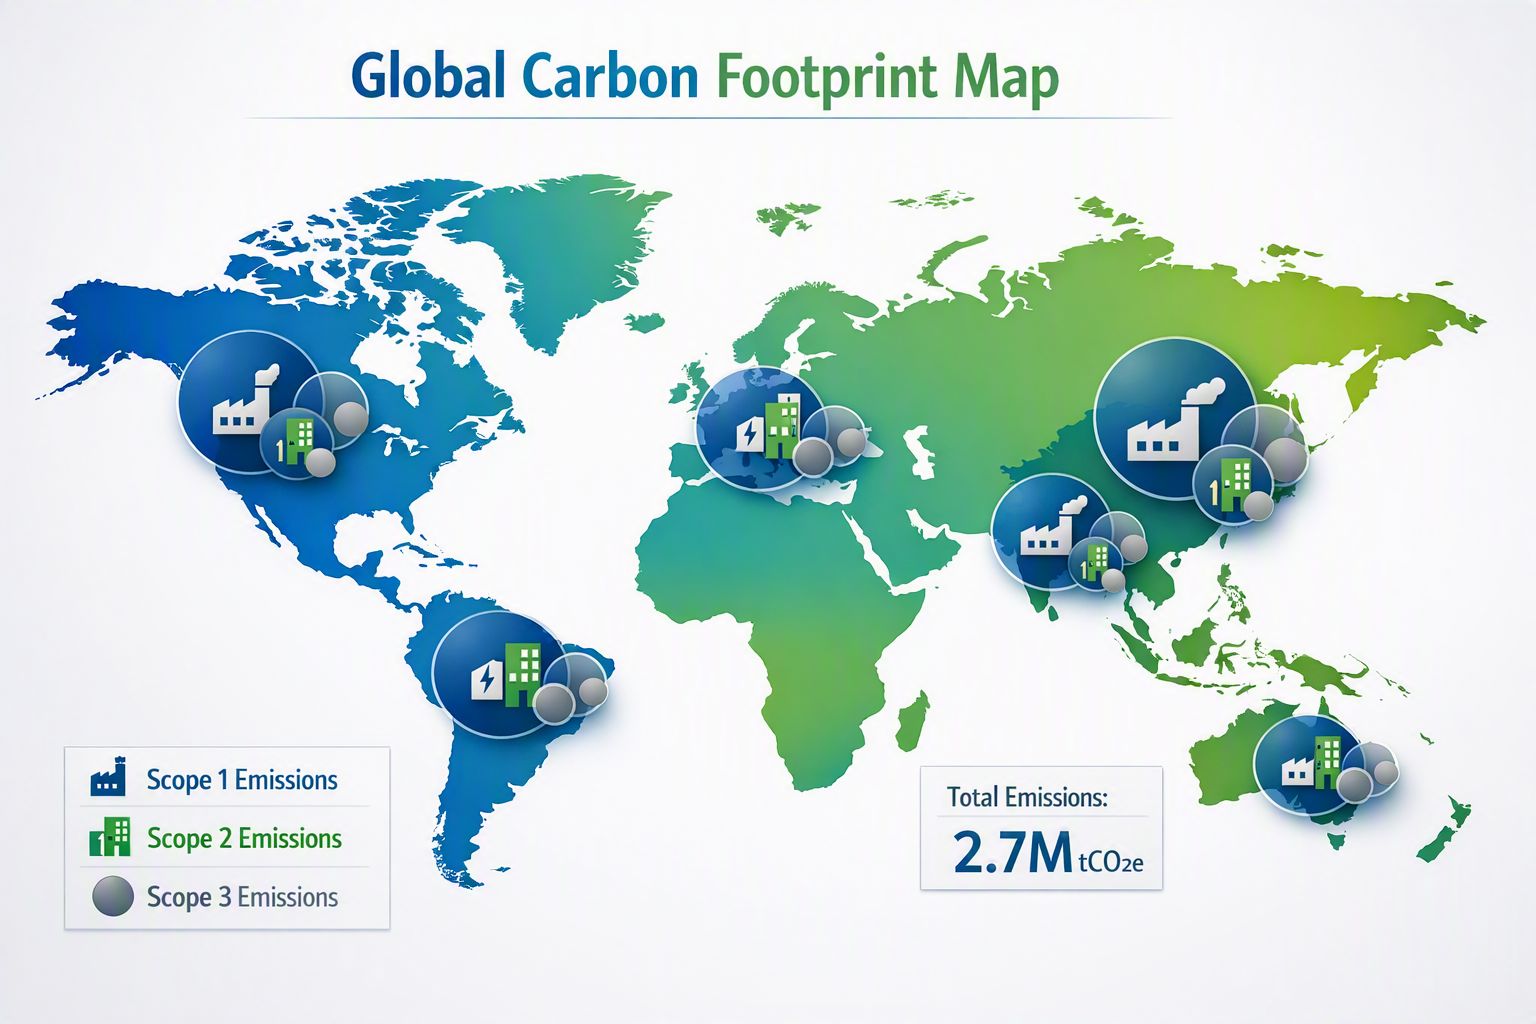
8 Countries |
24 Subsidiaries |
420+ Facilities |
USD 4.5B Revenue |
|
38,000+ Employees |
2.7M tCO2e Annual Footprint |
120+ ESG Targets |
CONSOLYX Enterprise Sustainability Intelligence Platform |
Executive Summary
A diversified holding group operating across eight countries had ESG data in many places, but not in a form that leadership could use with confidence. Sustainability information was collected through spreadsheets, local systems and subsidiary submissions; carbon calculations varied by facility, country and operating unit; and board reporting relied heavily on manual consolidation.
CONSOLYX was implemented as an Enterprise Sustainability Intelligence Platform connecting subsidiaries, facilities, departments, carbon activity data, ESG indicators, targets, framework mapping, dashboards and AI-enabled insights. It standardized Scope 1, Scope 2 and Scope 3 reporting while creating a governed single source of truth for executive, investor and board review.
The transformation moved ESG from fragmented compliance reporting to enterprise performance management. The group improved reporting speed, strengthened data confidence, created visibility across 420+ facilities and connected sustainability targets with FP&A, capital allocation and financial consolidation.
Why This Transformation Was Different
This was not treated as a reporting tool implementation. It was designed as an enterprise operating model where sustainability data, carbon calculations, financial planning and governance workflows work together. The group created one controlled ESG data foundation, linked performance to accountable owners, and gave leadership a practical view of risks, targets, investment needs and business impact.
|
Traditional ESG Reporting |
CONSOLYX Transformation |
|
Manual data collection for periodic reports. |
Continuous ESG intelligence across subsidiaries, facilities and functions. |
|
Carbon and ESG reported separately from finance. |
ESG linked with FP&A, budgets, scenarios and financial consolidation. |
|
Board packs prepared after the fact. |
Decision-ready dashboards, alerts and investor narratives available on demand. |
Key Outcomes
· 24 subsidiaries integrated into a common ESG and carbon reporting model.
· 420+ facilities monitored with consistent environmental, social, governance and carbon data structures.
· 2.7 million tCO2e annual carbon footprint managed through a centralized carbon accounting engine.
· Scope 1, Scope 2 and Scope 3 reporting standardized across business units.
· Executive ESG dashboards deployed for group, subsidiary, facility and board-level review.
· AI-powered sustainability insights introduced for anomalies, risks, target deviations and reduction opportunities.
· Enterprise-wide target tracking established across carbon, energy, water, waste, workforce and governance indicators.
· Investor reporting improved through consistent metrics, evidence trails and executive summaries.
· ESG governance enhanced through ownership, accountability and audit-ready reporting workflows.
· Strategic decision-making improved by connecting sustainability data with performance management and capital planning.
Business Challenge
The group operated across multiple countries, industries and reporting environments. Each subsidiary had its own operating model, local reporting format, facility-level data capture process and maturity level. Environmental data was available, but it was not consistently structured. Social and governance indicators were maintained separately. Carbon calculations were often performed using local spreadsheets, manual assumptions or inconsistent emission factors.
This created practical issues for senior leadership. The CFO did not have a reliable view of sustainability performance by subsidiary, facility, geography or business line. The sustainability team could not easily reconcile data across reporting cycles. Board packs were prepared manually, and investor queries required repeated follow-up across functions. Targets existed, but were not always linked to owners, budgets, initiatives or measurable performance outcomes.
Why This Matters
Large organizations cannot manage ESG performance using isolated spreadsheets. Enterprise groups require consistency, governance, accountability, comparability, board visibility and investor confidence.
Key Problems Identified
|
Challenge |
Impact |
Business Risk |
|
Data Fragmentation |
ESG data was dispersed across subsidiaries, facilities, departments and spreadsheets. |
Leadership decisions were based on incomplete or delayed information. |
|
Carbon Reporting Inconsistency |
Emission calculations varied by business unit and reporting cycle. |
Carbon disclosures could be challenged by investors, auditors or regulators. |
|
Lack of Visibility |
Group executives could not easily compare performance across countries or facilities. |
High-emission locations and operational risks remained hidden. |
|
Target Tracking Challenges |
Targets were not consistently linked to owners, initiatives, budgets or timelines. |
Net-zero and sustainability commitments were difficult to monitor. |
|
Supply Chain Complexity |
Scope 3 data depended on suppliers, logistics partners and procurement inputs. |
Value-chain emissions were exposed to estimation risk and weak evidence trails. |
|
Framework Compliance Gaps |
ESG indicators were not fully mapped to reporting frameworks and disclosure needs. |
Reports required significant manual interpretation and rework. |
|
Manual Reporting Burden |
Monthly, quarterly and annual reporting relied heavily on manual consolidation. |
Finance and sustainability teams spent more time preparing data than analyzing it. |
|
Weak Audit Trails |
Data changes, assumptions and approvals were not consistently traceable. |
Assurance readiness and management confidence were limited. |
Project Objectives
|
Objective |
Success Criteria |
|
Carbon Accounting |
Standardize Scope 1, Scope 2 and Scope 3 calculations across all subsidiaries and facilities. |
|
ESG Reporting |
Create a consistent structure for environmental, social and governance data capture. |
|
Subsidiary Reporting |
Enable each subsidiary to submit, review and monitor ESG performance in a controlled workflow. |
|
Group Reporting |
Consolidate ESG and carbon data into group-level executive reporting. |
|
Dashboard Analytics |
Provide real-time visual insights for executives, sustainability teams and finance leaders. |
|
Framework Mapping |
Map metrics to recognized sustainability reporting requirements and investor disclosure expectations. |
|
AI Insights |
Identify anomalies, high-emission areas, target deviations and improvement opportunities. |
|
Audit Readiness |
Maintain evidence trails, calculation logic, approvals and data history. |
|
Board Reporting |
Produce concise, decision-ready ESG packs for the board and executive committees. |
Enterprise ESG Operating Model
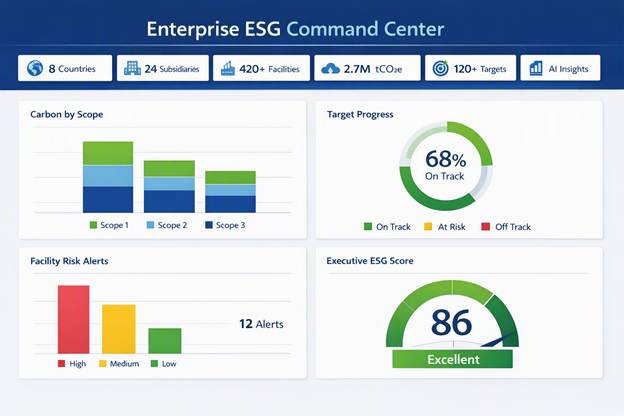
Subsidiaries → Facilities → Departments → CONSOLYX ESG → Carbon Engine → Framework Mapping → Dashboards → AI Insights → Board Reporting
· Subsidiaries: Each legal entity owns its ESG submissions, local evidence and operational accountability.
· Facilities: Plant, warehouse, store, office and service locations capture energy, fuel, water, waste and activity data.
· Departments: Finance, sustainability, operations, procurement, HR and compliance teams contribute validated indicators.
· CONSOLYX ESG: The central platform stores master data, reporting cycles, targets, metrics, evidence and ownership.
· Carbon Engine: Activity data is converted into emissions using consistent calculation logic and emission factors.
· Framework Mapping: ESG metrics are mapped to disclosure needs, investor questions and management reporting structures.
· Dashboards: Executives monitor performance by group, country, subsidiary, facility, scope, category and target.
· AI Insights: The platform highlights risks, anomalies, outliers, opportunities and scenario implications.
· Board Reporting: Final outputs support board packs, sustainability committees, investor presentations and strategic reviews.
Data Coverage
· Environmental: Energy, water, waste, emissions, renewable energy and resource efficiency.
· Social: Workforce, health and safety, diversity, training, community investment and human capital indicators.
· Governance: Policies, controls, compliance, ethics, board oversight, risk management and approvals.
· Carbon: Scope 1, Scope 2 and Scope 3 activity data, emission factors and calculated tCO2e results.
· Targets: Reduction targets, baseline years, owners, milestones and progress tracking.
· Compliance: Disclosure indicators, evidence requirements, internal approvals and reporting status.
· Supply Chain: Supplier activity data, procurement categories, logistics impacts and value-chain risk indicators.
· Investment Programs: Capital projects, decarbonization initiatives, energy efficiency programs and expected benefits.
· Risk Indicators: Physical risk, transition risk, compliance risk, data quality risk and reputational exposure.
Carbon Accounting Model
The carbon model was structured around the common corporate greenhouse gas inventory approach used by organizations to classify direct emissions, purchased energy emissions and value-chain emissions. The model supports Scope 1 emissions from owned or controlled sources, Scope 2 emissions from purchased electricity, steam, heat and cooling, and Scope 3 emissions from upstream and downstream activities in the value chain.
|
Emission Scope |
Example Coverage |
Annual Emissions |
Management Implication |
|
Scope 1 |
Company-owned fuel, fleet, boilers, generators and direct operational emissions. |
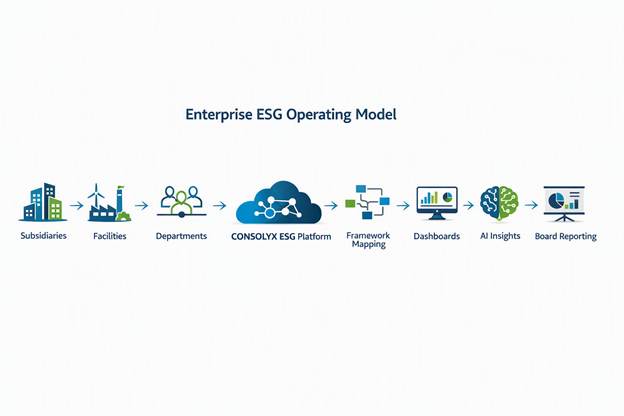
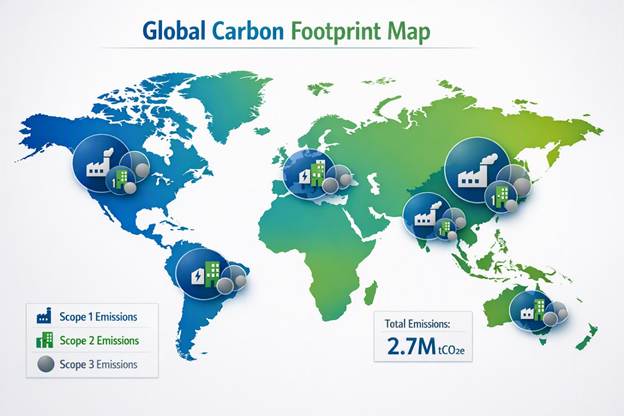
620,000 tCO2e |
Requires operational efficiency, fuel transition and facility-level accountability. |
|
Scope 2 |
Purchased electricity, cooling, steam and energy consumed by operations. |
1,420,000 tCO2e |
Requires renewable energy strategy, procurement alignment and energy optimization. |
|
Scope 3 |
Supply chain, logistics, purchased goods, business travel and other value-chain categories. |
660,000 tCO2e |
Requires supplier engagement, procurement visibility and improved estimation governance. |
|
Total |
Enterprise carbon footprint |
2,700,000 tCO2e |
Requires integrated carbon governance across operations, finance and strategy. |
ESG Dashboards
|
Dashboard |
Purpose |
Primary Users |
Business Value |
|
Executive Dashboard |
Summarizes ESG performance, risks, targets and key movements. |
CEO, CFO, Board, Strategy Team |
Improves leadership visibility and supports decision-making. |
|
Carbon Dashboard |
Tracks Scope 1, 2 and 3 emissions by entity, country, facility and source. |
Sustainability, Finance, Operations |
Identifies high-emission areas and decarbonization priorities. |
|
Subsidiary Dashboard |
Shows ESG performance for each subsidiary and operating unit. |
Subsidiary CEOs, Finance Heads, ESG Managers |
Improves accountability and local ownership. |
|
Target Dashboard |
Compares actual performance against sustainability targets and milestones. |
ESG Committee, FP&A, Business Units |
Links commitments with measurable progress. |
|
Compliance Dashboard |
Monitors reporting readiness, evidence status and framework mapping. |
Compliance, Internal Audit, Reporting Teams |
Strengthens audit readiness and reduces disclosure gaps. |
|
AI Dashboard |
Highlights anomalies, risks, trends and recommended actions. |
CFO, Sustainability Director, Analysts |
Converts ESG data into actionable intelligence. |
|
Investor Dashboard |
Presents investor-relevant ESG metrics, risks and progress narratives. |
Investor Relations, CFO, Board |
Improves credibility and transparency with capital markets. |
|
Board Dashboard |
Provides concise, strategic ESG intelligence for governance meetings. |
Board Members, Committees, Executive Leadership |
Supports oversight, accountability and strategic alignment. |
AI-Powered Sustainability Insights
· High Emission Facilities: Identify facilities contributing disproportionately to emissions intensity.
· Target Deviations: Highlight entities or categories falling behind reduction targets.
· Supply Chain Risks: Detect supplier categories with weak Scope 3 data quality or rising emissions exposure.
· Carbon Reduction Opportunities: Recommend operational areas where efficiency, renewable energy or process changes may reduce emissions.
· Framework Gaps: Identify missing indicators, incomplete evidence or disclosure gaps before reporting deadlines.
· Investment Prioritization: Compare decarbonization initiatives by expected impact, cost, timing and strategic relevance.
· Scenario Analysis: Model how energy price changes, emissions factors, growth plans or capital investments affect future ESG outcomes.
· Budget Optimization: Connect sustainability initiatives with financial planning and capital allocation decisions.
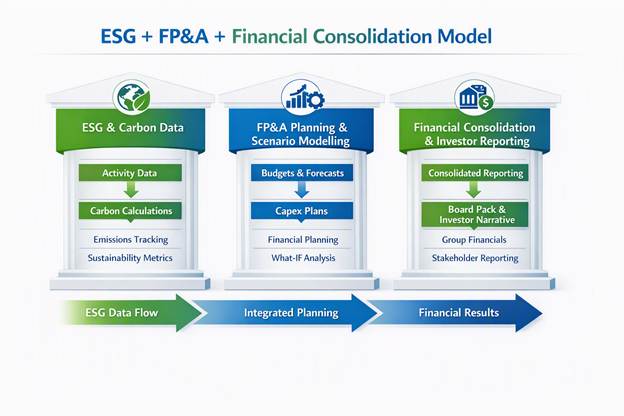
ESG + FP&A + Financial Consolidation Model
CONSOLYX connected ESG, FP&A and financial consolidation so sustainability commitments could be evaluated like enterprise performance drivers. Carbon activity, reduction initiatives, capex plans, operating budgets and reporting outcomes were brought into one management rhythm rather than handled as separate exercises.
This gave the CFO team a practical way to assess the financial implications of sustainability choices. Energy efficiency programs were reflected in budgets, carbon reduction initiatives were linked to capital plans, and scenario analysis compared investment options under different growth, price and regulatory assumptions.
Enterprise ESG Maturity Model
|
Maturity Level |
Typical State |
CONSOLYX Outcome |
|
1. Fragmented |
Spreadsheets, inconsistent definitions and manual follow-ups. |
Centralized ESG data model and controlled submissions. |
|
2. Standardized |
Common templates, but limited automation and weak evidence trails. |
Validated workflows, calculation logic and audit-ready evidence. |
|
3. Integrated |
ESG linked with operations, finance, targets and reporting cycles. |
Dashboards, FP&A alignment and consolidated executive reporting. |
|
4. Intelligent |
Leadership uses ESG data for planning, risk and investment decisions. |
AI insights, scenario analysis and investor-ready sustainability intelligence. |
Investor Reporting Benefits
|
Investor Need |
CONSOLYX Capability |
Business Value |
|
Consistent ESG Metrics |
Standardized data model across subsidiaries, facilities and countries. |
Improves comparability and reduces explanation effort. |
|
Carbon Transparency |
Scope-based carbon accounting with activity data and calculation logic. |
Supports credible emissions reporting and decarbonization discussions. |
|
Target Progress |
Target tracking by owner, timeline, baseline and performance status. |
Demonstrates execution discipline and accountability. |
|
Governance Evidence |
Workflow controls, approvals, audit trails and evidence management. |
Builds confidence in reported sustainability information. |
|
Risk Visibility |
Dashboards and AI insights for climate, compliance and operational risks. |
Supports investor conversations around resilience and risk management. |
Investor Perspective
For investors, the value was not only better ESG disclosure. It was the ability to see whether sustainability commitments were governed, funded, measured and connected to enterprise performance.
Results Achieved
|
Outcome Area |
Before |
After |
Measurable Impact |
|
Reporting Cycle |
Manual monthly and quarterly consolidation. |
Structured platform-based reporting cycles. |
Reporting preparation reduced from weeks to days. |
|
Enterprise Coverage |
Incomplete facility-level visibility. |
420+ facilities monitored in a common data model. |
Full group coverage across 8 countries and 24 subsidiaries. |
|
Carbon Visibility |
Limited view by scope, facility and category. |
Scope 1, 2 and 3 dashboards across the enterprise. |
2.7M tCO2e managed through consistent calculation logic. |
|
Target Management |
Targets tracked separately from operating and financial data. |
Targets linked to owners, baselines, actuals and initiatives. |
120+ targets monitored with accountability and progress tracking. |
|
Board and Investor Reporting |
Static presentations and repeated data requests. |
Board-ready dashboards, investor summaries and evidence trails. |
Faster response to board, lender and investor ESG queries. |
|
Audit Readiness |
Limited traceability of assumptions, approvals and changes. |
Workflow approvals, evidence and calculation traceability. |
Improved assurance readiness and management confidence. |
Enterprise ESG Command Center
|
[Graphic Placeholder: Enterprise ESG Command Center] KPI |
Example Value |
|
Facilities |
420+ |
|
Countries |
8 |
|
Subsidiaries |
24 |
|
Total Emissions |
2.7M tCO2e |
|
Targets |
120+ |
|
Dashboard Users |
1,000+ |
|
Compliance Indicators |
250+ |
|
AI Alerts |
2,000+ |
Executive Quote
“Before CONSOLYX, we had ESG information across the group, but we lacked ESG intelligence. Today, we have a single source of truth across subsidiaries, facilities and countries, with carbon visibility, target tracking and board-level insights in one place.”
Why CONSOLYX
· Enterprise Sustainability Intelligence Platform for ESG, carbon accounting, dashboards and reporting governance.
· Multi-entity and multi-country reporting for holding companies, subsidiaries, facilities and departments.
· Scope 1, Scope 2 and Scope 3 carbon accounting with consistent calculation logic and evidence trails.
· Executive dashboards, AI insights and framework mapping for board, investor and management reporting.
· Alignment with FP&A and financial consolidation so ESG performance is connected to budgets, forecasts, capital plans and enterprise value.
Applicable Industries
Manufacturing | Retail | Logistics | Technology | Energy | Construction | Healthcare | Telecommunications | Financial Services | Holding Companies
Recommended Visual Storyline
· Enterprise ESG Command Center
· Enterprise ESG Operating Model
· Global Carbon Footprint Map
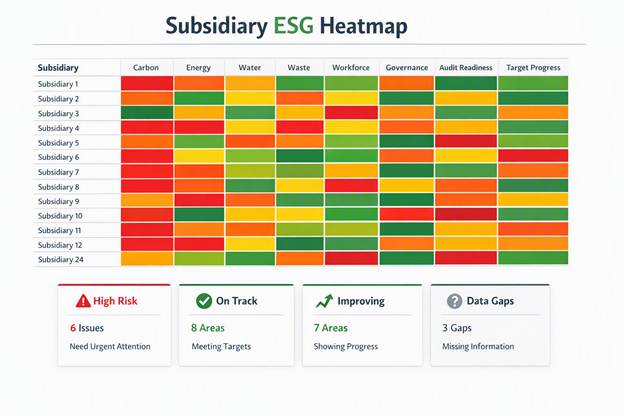
· Subsidiary ESG Heatmap
· ESG + FP&A + Financial Consolidation Model
· CONSOLYX ESG Architecture
Ready to Transform Enterprise ESG Reporting?
Discover how CONSOLYX helps enterprise groups turn ESG, carbon and sustainability data into governed, auditable and decision-ready sustainability intelligence across countries, subsidiaries and facilities.
Book a Demo | Request Presentation | Schedule Consultation